class: inverse, center background-image: url("img/darklight_RichardStrozynski.jpg") background-size: contain <style> a, a > code { color: #e2ac00; text-decoration: none; } .remark-slide-number { position: inherit; } .remark-slide-number .progress-bar-container { position: absolute; bottom: 0; height: 4px; display: block; left: 0; right: 0; } .remark-slide-number .progress-bar { height: 100%; background-color: #baa745; } .remark-inline-code { color: #ebc500; } .remark-code-line-highlighted { background-color: #ffec89; } .hljs-github .hljs { background: #ececec; } .pull-left { float: left; width: 50%; } .pull-right { float: right; width: 50%; } .corner { margin: 0; position: absolute; top: 65%; left: 80%; -ms-transform: translate(-40%, -40%); transform: translate(-40%, -40%); } </style> <br><br> # **The Grammar of `{ggplot2}`**<br><font size=7 color="#a7a7a7">A graphics framework for elegant plotting in **`R`**</font> <br><br><br><br><br> ### **Cédric Scherer**<br><font size=5 color="#a7a7a7">Leibniz Institute for Zoo and Wildlife Research Berlin</font><br><font size=4 color="#ccba56"><b>scherer@izw-berlin.de | cedricscherer.netlifiy.com | @CedScherer</b></font> <br><br><br> ### <p align="right"><font size=3 color="#767676">Image by Richard Strozynski</font></p> --- class: center, middle <p style="text-align:center;"><img src="img/logo.png" style="width: 20%"> <br><br> ### <font size=7>**`{ggplot2}`** is a system for declaratively creating graphics,<br>based on "The Grammar of Graphics" (Wilkinson, 2005).</font> ### <font size=6>You provide the data, tell **`{ggplot2}`** how to map variables to aesthetics,<br>what graphical primitives to use, and it takes care of the details.</font> <font size="3" color="grey"><br><i>ggplot2 package description</i></font> --- class: middle # **Advantages of `{ggplot2}`** * consistent underlying grammar of graphics (Wilkinson, 2005) * very flexible, layered plot specification * theme system for polishing plot appearance * active and helpful community (e.g. [community.rstudio.com](wwww.community.rstudio.com), [R4DS Learning Community](https://www.rfordatasci.com), [Twitter](https://twitter.com/search?q=%23ggplot2&src=typed_query)) --- class: inverse, center, middle # **The `{ggplot2}` Showcase** --- class: inverse <p style="text-align:center;"><img src="img/Fig2_disease-data_full_log.png" style="width: 53%"><br><font color="lightgrey" size=3><i>Figure in Scherer et al. 2019 J. Anim. Ecol.</i></font> --- class: inverse, center, middle <p style="text-align:center;"><img src="img/2019-08-18_phone-use.png" style="width: 74%"><br><font color="lightgrey" size=3><i>Contribution to #MakeoverMonday</i></font> --- class: inverse, center, middle <p style="text-align:center;"><img src="img/2019_18_BirdCollisions.png" style="width: 68%"><br> <p style="text-align:center;"><img src="img/2019_19_StudentTeacher.png" style="width: 68%"><br><font color="lightgrey" size=3><i>Contribution to #TidyTuesday</i></font> --- class: inverse, center, middle <p style="text-align:center;"><img src="img/2019_34_NuclearExplosions.png" style="width: 68%"><br> <p style="text-align:center;"><img src="img/2019_24_Meteorites.png" style="width: 68%"><br><font color="lightgrey" size=3><i>Contribution to #TidyTuesday</i></font> --- class: inverse, center, middle .pull-left[ <p style="text-align:center;"><img src="img/georgos_bob_ross.png" style="width: 98%"><br><font color="lightgrey" size=3><i>#TidyTuesday Contribution by Georgos Karamanis</i></font><br><font color="grey" size=2><i>(github.com/gkaramanis/tidytuesday)</i></font> ] .pull-right[ <p style="text-align:center;"><img src="img/jake_bird_collisions.png" style="width: 98%"><br><font color="lightgrey" size=3><i>#TidyTuesday Contribution by Jake Kaupp</i></font><br><font color="grey" size=2><i>(github.com/jkaupp/tidytuesdays)</i></font> ] --- class: inverse, center, middle .pull-left[ <br><br> <p style="text-align:center;"><img src="img/swiss_map.png" style="width: 98%"><br><font color="lightgrey" size=3><i>Bivariate Map by Timo Gossenbacher</i></font><br><font color="grey" size=2><i>(timogrossenbacher.ch/2019/04/bivariate-maps-with-ggplot2-and-sf)</i></font> ] .pull-right[ <p style="text-align:center;"><img src="img/europe_sprengler.jpeg" style="width: 98%"><br><font color="lightgrey" size=3><i>European Elections by Torsten Sprenger</i></font><br><font color="grey" size=2><i>(twitter.com/spren9er/status/1138000009306234880)</i></font> ] --- class: inverse, center, middle <p style="text-align:center;"><img src="img/bbc-gallery.png" style="width: 120%"><br><font color="lightgrey" size=3><i>Collection of BBC Graphics</i></font><br><font color="grey" size=2><i>(adapted from bbc.github.io/rcookbook)</i></font> --- class: inverse, center, middle .pull-left[ <p style="text-align:center;"><img src="img/gganimate-datasaurus.gif" style="width: 98%"> ] .pull-right[ <p style="text-align:center;"><img src="img/gganimate-hurricane.gif" style="width: 98%"> ] <font color="lightgrey" size=3><i>Examples of the {gganimate} Package</i></font><br><font color="grey" size=2><i>(github.com/thomasp85/gganimate/wiki)</i></font> --- class: inverse, center, middle <p style="text-align:center;"><img src="img/rayshader.gif" style="width: 120%"><br><font color="lightgrey" size=3><i>Demonstration of the {rayshader} Package</i></font><br><font color="grey" size=2><i>(tylermw.com/3d-maps-with-rayshader)</i></font> --- class: inverse, center, middle # **The Setup** --- ## **The package** <font size=5>**`{ggplot2}`** is a **data visualization package** for the statistical programming language **`R`**<br> created by Hadley Wickham in 2005. ```r install.packages("ggplot2") library(ggplot2) ``` -- <br><font size=4>**`{ggplot2}`** is part of the [**`{tidyverse}`**](https://blog.rstudio.org/2016/09/15/tidyverse-1-0-0/), a set of packages that work in harmony to manipulate and explore data. ```r install.packages("tidyverse") library(tidyverse) ``` <font size=4>**`{tidyverse}`** contains **`{ggplot2}`**, **`{dplyr}`**, **`{tidyr}`**, **`{readr}`**, **`{purrr}`**, **`{tibble}`** and some more packages. --- ## **The data** We use data from the *National Morbidity and Mortality Air Pollution Study* (NMMAPS),<br>filtered for the city of Chicago and the timespan January 1997 to December 2000. ```r chic <- readr::read_csv("https://raw.githubusercontent.com/z3tt/ggplot-courses/main/data/chicago-nmmaps-custom.csv") chic$year <- factor(chic$year, levels = as.character(1997:2000)) tibble::glimpse(chic) ``` ``` ## Observations: 1,461 ## Variables: 10 ## $ city <chr> "chic", "chic", "chic", "chic", "chic", "chic", "chic", "c... ## $ date <date> 1997-01-01, 1997-01-02, 1997-01-03, 1997-01-04, 1997-01-0... ## $ death <dbl> 137, 123, 127, 146, 102, 127, 116, 118, 148, 121, 110, 127... ## $ temp <dbl> 36.0, 45.0, 40.0, 51.5, 27.0, 17.0, 16.0, 19.0, 26.0, 16.0... ## $ dewpoint <dbl> 37.500, 47.250, 38.000, 45.500, 11.250, 5.750, 7.000, 17.7... ## $ pm10 <dbl> 13.052268, 41.948600, 27.041751, 25.072573, 15.343121, 9.3... ## $ o3 <dbl> 5.659256, 5.525417, 6.288548, 7.537758, 20.760798, 14.9408... ## $ time <dbl> 3654, 3655, 3656, 3657, 3658, 3659, 3660, 3661, 3662, 3663... ## $ season <fct> Winter, Winter, Winter, Winter, Winter, Winter, Winter, Wi... ## $ year <fct> 1997, 1997, 1997, 1997, 1997, 1997, 1997, 1997, 1997, 1997... ``` <font size="4" color="grey">For more details about the data set check Roger Peng's book [Statistical Methods in Environmental Epidemiology with R](http://www.springer.com/de/book/9780387781662). --- class: inverse, center, middle # **The Structure of `{ggplot2}`**<br><font size=6 color="#a7a7a7">"The Grammar of Graphics"</font> --- ## **The Structure of `{ggplot2}`** <br> 1. **Data** <font color="grey"> → The raw data that you want to visualise</font> 2. **Layers: `geom_` and `stat_`** <font color="grey"> → The geometric shapes and statistical summaries representing the data</font> 3. **Aesthetics `aes()`** <font color="grey"> → Aesthetic mappings of the geometric and statistical objects</font> 4. **Scales `scale_`** <font color="grey"> → Maps between the data and the aesthetic dimensions</font> 5. **Coordinate system `coord_`** <font color="grey"> → Maps data into the plane of the data rectangle</font> 6. **Facets `facet_`** <font color="grey"> → The arrangement of the data into a grid of plots</font> 7. **Visual themes `theme() and theme_`** <font color="grey"> → The overall visual defaults of a plot</font> --- class: inverse, center, middle # **1. Data<br><font size=6>`ggplot()`</font>** --- ### **1. Data: `ggplot()`** We need to specify data and the two variables we want to plot as **`aes`**tethics of the **`ggplot()`** call: .pull-left[ ```r *ggplot(data = chic, * mapping = * aes( * x = date, * y = temp * ) * ) ``` There is only an empty panel because<br>**`{ggplot2}` doesn't know *how* it should plot the data**. ] .pull-right[ <!-- --> ] --- ### **1. Data: `ggplot()`** We need to specify data and the two variables we want to plot as **`aes`**tethics of the **`ggplot()`** call: .pull-left[ Since almost every **`ggplot()`** takes the same arguments (**`data, mapping = aes(x, y)`**),<br>we can also write: ```r *ggplot(chic, aes(date, temp)) ``` ] .pull-right[ <!-- --> ] --- ### **1. Data: `ggplot()`** We need to specify data and the two variables we want to plot as **`aes`**tethics of the **`ggplot()`** call: .pull-left[ Since almost every **`ggplot()`** takes the same arguments (**`data, mapping = aes(x, y)`**),<br>we can also write: ```r ggplot(chic, aes(date, temp)) ``` ... or add the **`aes`**thetics outside the **`ggplot`** function: ```r ggplot(chic) + * aes(date, temp) ``` ] .pull-right[ <!-- --> ] --- class: inverse, center, middle # **2. Layers<br><font size=6 color = "grey">`geom_*()` and `stat_*()`</font>** --- ### **2. Layers: `geom_*()` and `stat_*()`** <font size=4>By adding one or multiple layers we can tell **`{ggplot2}`** *how* to represent the data.<br> There are lots of build-in geometrics elements (**`geoms`**) and statistical transformations (**`stats`**): <p style="text-align:center;"><img src="img/ggplot-layers.png" style="width: 57%"><font color="grey" size=2><i>Adapted from ggplot2.tidyverse.org/reference/</i></font></p> <font size=2>... and several more in extension packages, e.g. **`{ggforce}`**, **`{ggalt}`**, **`{ggridges}`**, **`{ggrepel}`**, **`{ggcorrplot}`**, **`{ggraph}`**, **`{ggdendro}`** & **`{ggalluvial}`**. --- ### **2. Layers — Geometries: `geom_point()`** We can tell **`{ggplot2}`** to represent the data for example as a **scatterplot**: .pull-left[ ```r ggplot(chic, aes(date, temp)) + * geom_point() ``` ] .pull-right[ <!-- --> ] --- ### **2. Layers — Geometries: `geom_line()`** ... or a **line plot**: .pull-left[ ```r ggplot(chic, aes(date, temp)) + * geom_line() ``` ] .pull-right[ <!-- --> ] --- ### **2. Layers — Geometries: `geom_area()`** ... or an **area plot**: .pull-left[ ```r ggplot(chic, aes(date, temp)) + * geom_area() ``` ] .pull-right[ <!-- --> ] --- ### **2. Layers — Geometries: `geom_boxplot()`** ... or a **box and whiskers plot**: .pull-left[ ```r ggplot(chic, aes(date, temp)) + * geom_boxplot() ``` ] .pull-right[ <!-- --> ] --- ### **2. Layers — Geometries: `geom_boxplot()`** ... or a **box and whiskers plot**: .pull-left[ ```r ggplot(chic, aes(date, temp)) + * geom_boxplot() ``` <br><font size=6><b>What's going on here?!</b></font> ] .pull-right[ 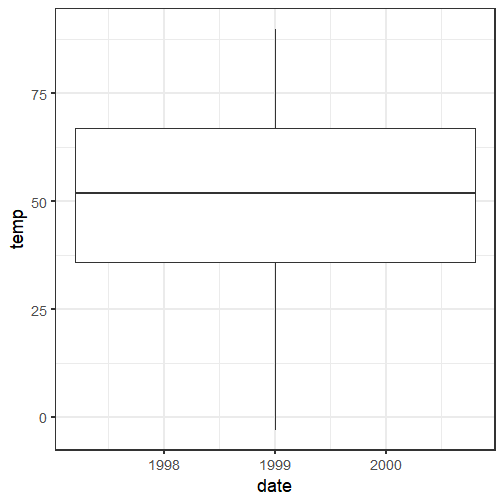<!-- --> ] --- ### **2. Layers — Geometries: `geom_boxplot()`** We need to specify the variable as **categorial** (**`year`**), not as **continuous** (**`date`**): .pull-left[ ```r *ggplot(chic, aes(year, temp)) + geom_boxplot() ``` ] .pull-right[ 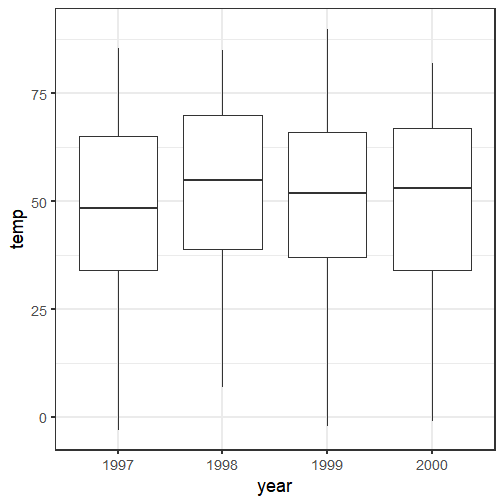<!-- --> ] --- ### **2. Layers — Geometries: Using Multiple `geom_*()`** Other layers can be added to an existing plot - a line and a rug representation for example: .pull-left[ ```r ggplot(chic, aes(date, temp)) + geom_point() + * geom_line() + * geom_rug(sides = "r") ``` ] .pull-right[ 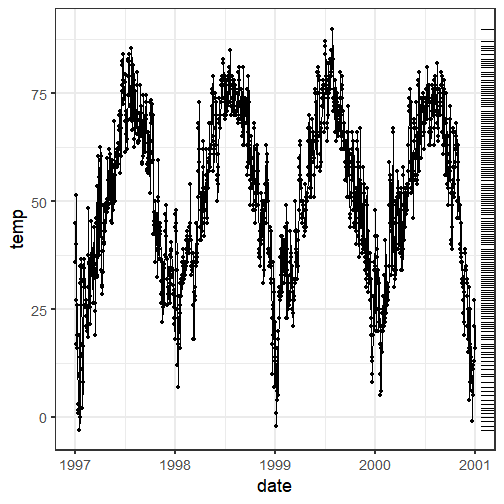<!-- --> ] --- ### **2. Layers — Statistical transformations: `stat_summary()`** A handful of layers with attention to the statistical transformation rather than the visual appearance: .pull-left[ ```r ggplot(chic, aes(year, temp)) + geom_boxplot() + * stat_summary( * fun.y = mean, * geom = "point" * ) ``` ] .pull-right[ 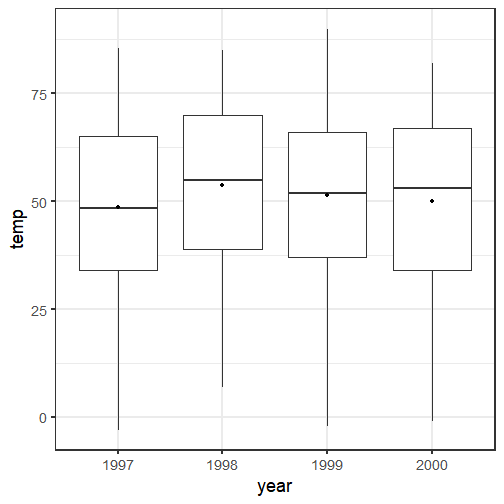<!-- --> ] --- ### **2. Layers — Statistical transformations: `stat_function()`** **`stat_function()`** makes it easy to add a function to a plot, either continuous or discrete: .pull-left[ ```r ggplot(tibble(x = c(-8, 8)), aes(x)) + * stat_function(fun = dnorm) + * stat_function( * fun = dcauchy, * geom = "point", * n = 75 * ) ``` ] .pull-right[ 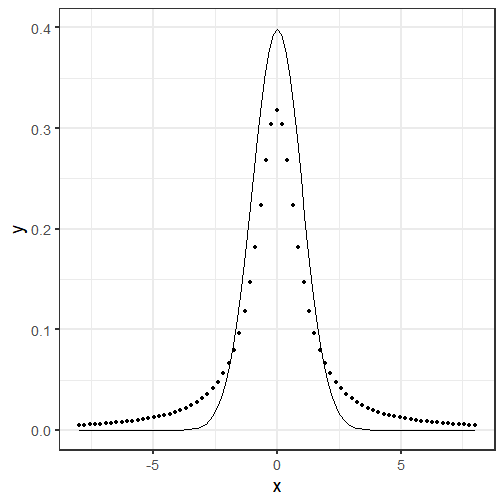<!-- --> ] --- ### **2. Layers — Statistical transformations: `stat_ecdf()`** You can also easily plot the empirical cumulative distribution function (ECDF) of a variable: .pull-left[ ```r ggplot(chic, aes(temp)) + * stat_ecdf(geom = "step") ``` ] .pull-right[ 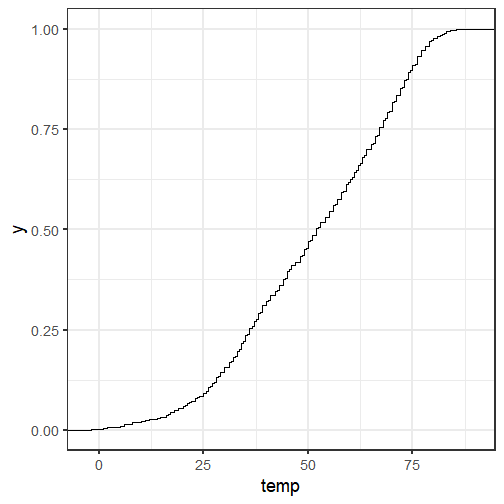<!-- --> ] --- ### **2. Layers — Statistical transformations: `stat_summary_hex()`** With **`stat_summary_hex()`** data is divided into bins defined by **`x`** and **`y`** and then filled with values of **`z`**: .pull-left[ ```r ggplot(chic, aes(date, temp, z = o3)) + * stat_summary_hex() ``` ] .pull-right[ 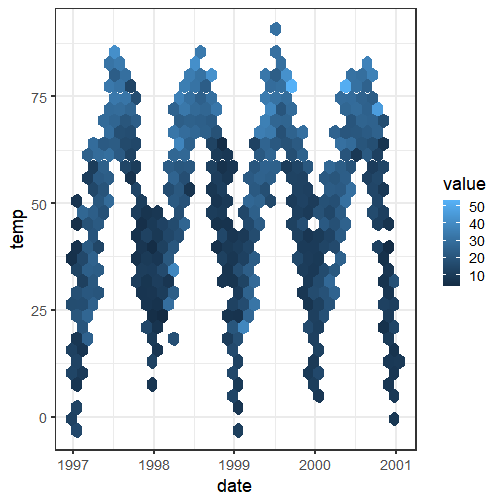<!-- --> ] --- ### **2. Layers — Statistical transformations: `stat_smooth()`** You can directly add smoothed conditional means: .pull-left[ ```r ggplot(chic, aes(date, temp)) + geom_point() + * stat_smooth() ``` ] .pull-right[ <!-- --> ] --- ### **2. Layers — Statistical transformations: `stat_smooth()`** You can directly add smoothed conditional means: .pull-left[ ```r ggplot(chic, aes(date, temp)) + geom_point() + * stat_smooth() ``` By default this adds a **LOESS** (locally weighted scatterplot smoothing, **`method = "loess"`**) or a <br>**GAM** (generalized additive model, **`method = "gam"`**) depending on the number of data points<br>(GAM in case of ≥ 1000 observations). ] .pull-right[ 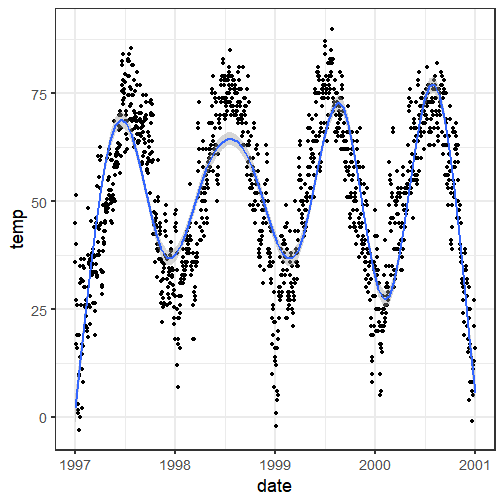<!-- --> ] --- ### **2. Layers — Statistical transformations: `stat_smooth()`** You can specify the fitting method and the formula: .pull-left[ ```r ggplot(chic, aes(date, temp)) + geom_point() + * stat_smooth( * method = "gam", * formula = y ~ s(x, k = 100), * se = F * ) ``` Other methods such as **`method = "lm"`** for linear regressions and **`method = "glm"`** for generalized linear models are available as well. ] .pull-right[ 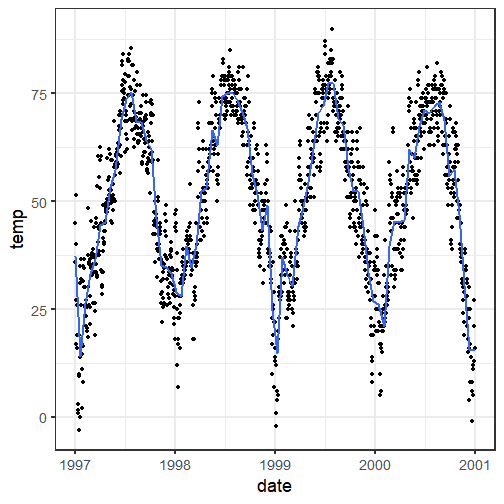<!-- --> ] --- ### **2. Layers — Statistical transformations: `stat_smooth()`** You can specify the fitting method and the formula: .pull-left[ ```r ggplot(chic, aes(date, temp)) + geom_point() + stat_smooth( * method = "lm", * formula = y ~ poly(x, 10), se = F ) ``` ] .pull-right[ 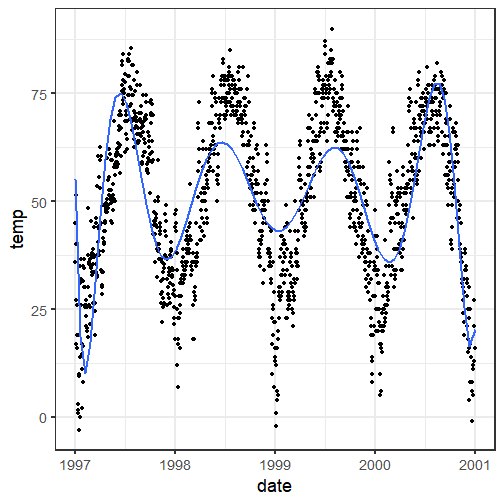<!-- --> ] --- class: inverse, center, middle # **3. Aesthetics<br><font size=6>`aes()`</font>** --- ### **3. Aesthetics: `aes()`** Aesthetics of the geometric and statistical objects, such as * **position** via **`x`**, **`y`**, **`xmin`**, **`xmax`**, **`ymin`**, **`ymax`**, ... -- * **colors** via **`color`** and **`fill`** * **transparency** via **`alpha`** -- * **sizes** via **`size`** and **`width`** * **shapes** via **`shape`** and **`linetype`** -- <br> In general, everything which maps to the data needs to be wrapped in **`aes()`**<br>while static arguments are placed outside the **`aes()`**. -- e.g.<br> **`geom_point(aes(color = season))`** to color points based on the variable **`season`**<br> **`geom_point(color = "grey")`** to color all points in the same color --- ### **3. Aesthetics: `aes(color/fill/alpha/size/shape)`** This way, we can enlarge all points and add some transparency: .pull-left[ ```r ggplot(chic, aes(date, temp)) + geom_point( * size = 4, * alpha = 0.2 ) ``` ] .pull-right[ 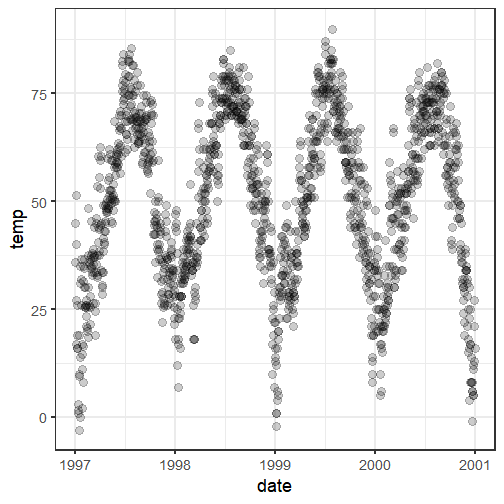<!-- --> ] --- ### **3. Aesthetics: `aes(color/fill/alpha/size/shape)`** ... and change the color and the shape based on **`season`** and **`year`**: .pull-left[ ```r ggplot(chic, aes(date, temp)) + geom_point( * aes( * color = season, * shape = year * ), size = 4, alpha = 0.2 ) ``` ] .pull-right[ 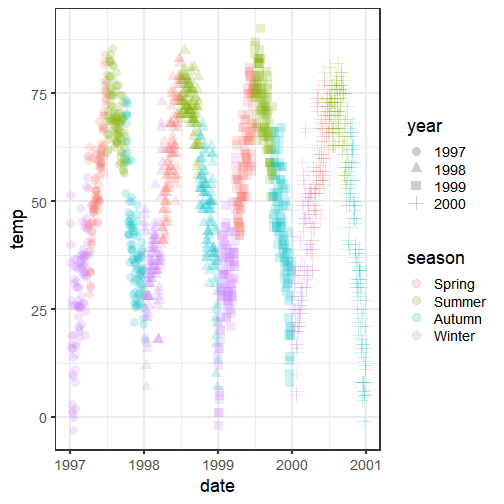<!-- --> ] --- ### **3. Aesthetics: `aes(color/fill/alpha/size/shape)`** Alternatively, all **`aes`**thetics can be grouped together (and are then applied to all **`geoms`** and **`stats`**): .pull-left[ ```r ggplot( chic, aes(date, temp, * color = season, * shape = year) ) + geom_point( size = 4, alpha = 0.2 ) ``` ] .pull-right[ <!-- --> ] --- ### **3. Aesthetics: `aes(group)`** You can create subsets of the data by specifying a grouping variable via **`group`**: .pull-left[ ```r ggplot(chic, aes(temp)) + stat_ecdf( * aes(group = year), geom = "step" ) ``` <br>However, for most applications you can simply specify the grouping using visual aesthetics<br>(**`color`**, **`fill`**, **`alpha`**, **`shape`**, **`linetype`**). ] .pull-right[ 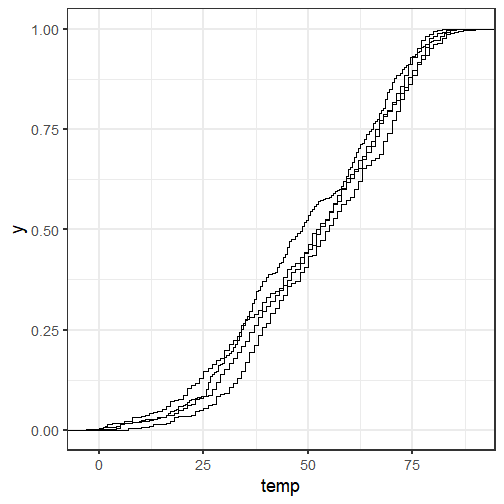<!-- --> ] --- ### **3. Aesthetics: `aes(group)`** You can create subsets of the data by specifying a grouping variable via **`group`**: .pull-left[ ```r ggplot(chic, aes(temp)) + stat_ecdf( * aes(color = year), geom = "step" ) ``` <br>However, for most applications you can simply specify the grouping using visual aesthetics<br>(**`color`**, **`fill`**, **`alpha`**, **`shape`**, **`linetype`**). ] .pull-right[ 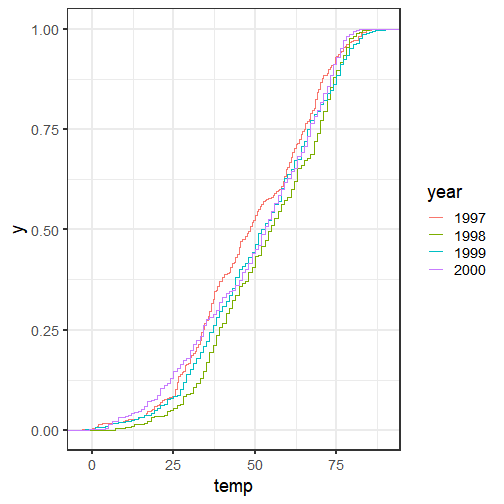<!-- --> ] --- class: inverse, center, middle # **4. Scales<br><font size=6>`scale_*()`</font>** --- ### **4. Scales: `scale_`** One can use **`scale_*()`** to change properties of all the **aesthetic dimensions mapped to the data**. -- <br>Consequently, there are **`scale_*()`** functions for all aesthetics such as: * **position** via **`scale_x_*()`** and **`scale_y_*()`** * **colors** via **`scale_color_*()`** and **`scale_fill_*()`** * **transparency** via **`scale_alpha_*()`** * **sizes** via **`scale_size_*()`** * **shapes** via **`scale_shape_*()`** and **`scale_linetype_*()`** -- ... with extensions (**`*`**) such as * **`continuous()`**, **`discrete()`**, **`reverse()`**, **`log10()`**, **`squrt()`**, **`date()`**, **`time()`** for axes * **`continuous()`**, **`discrete()`**, **`manual()`**, **`gradient()`**, **`hue()`**, **`brewer()`** for colors and fills * **`continuous()`**, **`discrete()`**, **`manual()`**, **`ordinal()`**, **`identity()`**, **`date()`** for transparencies * **`continuous()`**, **`discrete()`**, **`manual()`**, **`ordinal()`**, **`identity()`**, **`area()`**, **`date()`** for sizes * **`continuous()`**, **`discrete()`**, **`manual()`**, **`ordinal()`**, **`identity()`** for shapes and linetypes --- ### **4. Scales: `scale_x_*()` and `scale_y_*()`** For example, to change the titles of the axes... .pull-left[ ```r ggplot(chic, aes(date, temp)) + geom_point(aes(color = season)) + * scale_x_date( * name = NULL * ) + * scale_y_continuous( * name = "Temperature (°F)" * ) ``` ] .pull-right[ 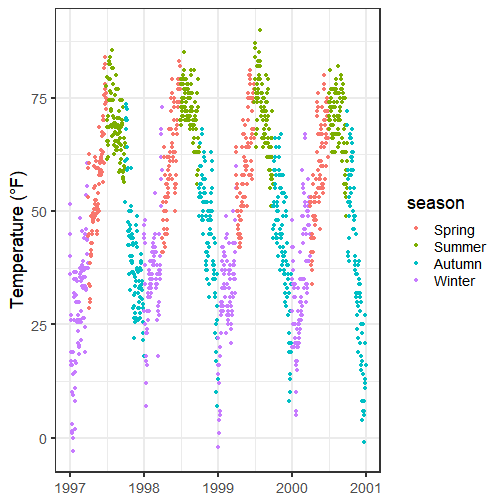<!-- --> ] --- ### **4. Scales: `scale_x_*()` and `scale_y_*()`** ... and their properties such as the range, scaling, labels, and axis breaks: .pull-left[ ```r ggplot(chic, aes(date, temp)) + geom_point(aes(color = season)) + scale_x_date( name = NULL, * limits = c( * as.Date("1997-01-01"), * as.Date("1999-12-31") * ) ) + * scale_y_log10( name = "Temperature (°F)", * breaks = c(1, 10, 100), * labels = scales::scientific ) ``` ] .pull-right[ 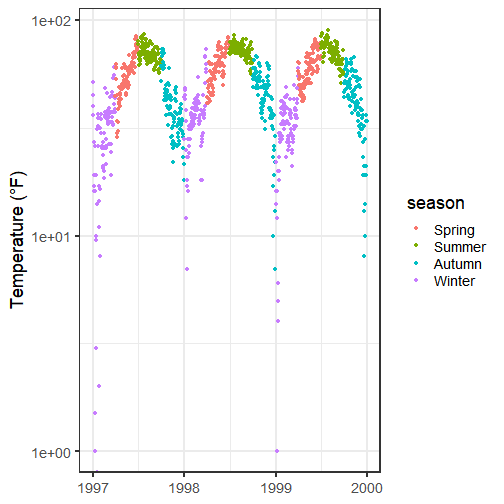<!-- --> ] --- ### **4. Scales: `scale_x_*()` and `scale_y_*()`** With **`breaks`** and **`labels`** it's also possible to alter the labels without changing the data: .pull-left[ ```r ggplot(chic, aes(date, temp)) + geom_point(aes(color = season)) + scale_x_date( name = NULL, limits = c( as.Date("1997-01-01"), as.Date("1999-12-31") ) ) + scale_y_continuous( * name = "How I feel...", * breaks = c(0, 30, 60, 90), * labels = c( * '"Brrr, too cold!"', * '"Still freezing."', * '"Okay."', * '"Uff, too hot!"' * ) ) ``` ] .pull-right[ 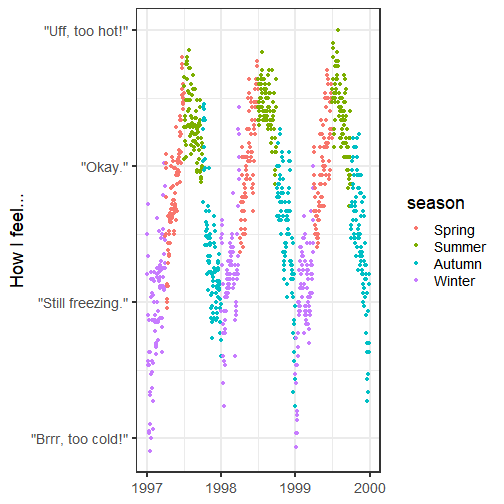<!-- --> ] --- ### **4. Scales: `scale_x_*()` and `scale_y_*()`** Some people are annoyed by the extra spacing around the data but we can remove that: .pull-left[ ```r ggplot(chic, aes(date, temp)) + geom_point(aes(color = season)) + scale_x_date( name = NULL, * expand = c(0, 0) ) + scale_y_continuous( name = "Temperature (°F)", * expand = c(0, 0) ) ``` ] .pull-right[ 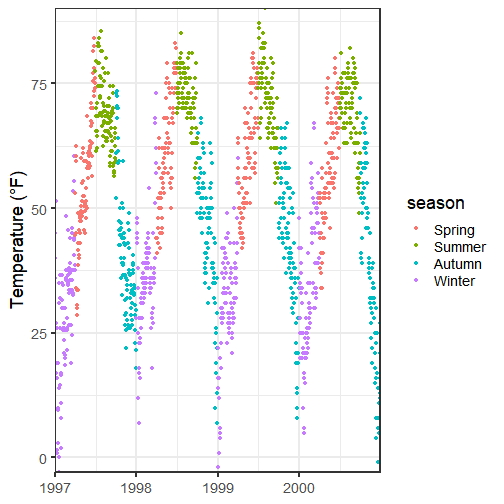<!-- --> ] --- ### **4. Scales: `scale_color_*()` and `scale_fill_*()`** Similarly, we can change properties of the other aesthetics. for example get rid of the default colors: .pull-left[ ```r ggplot(chic, aes(date, temp)) + geom_point(aes(color = season)) + * scale_color_manual( * values = c( * "firebrick", * "dodgerblue", * "darkorchid", * "goldenrod" * ) * ) ``` ] .pull-right[ 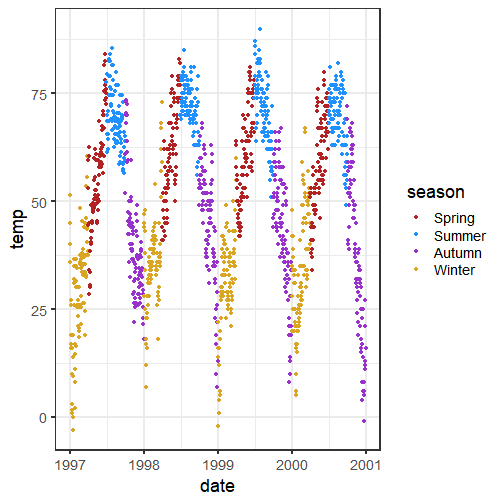<!-- --> ] --- ### **4. Scales: `scale_color_*()` and `scale_fill_*()`** ... and change the title of the legend: .pull-left[ ```r ggplot(chic, aes(date, temp)) + geom_point(aes(color = season)) + scale_color_manual( values = c( "firebrick", "dodgerblue", "darkorchid", "goldenrod" ), * name = "Pretty sesons:" ) ``` ] .pull-right[ 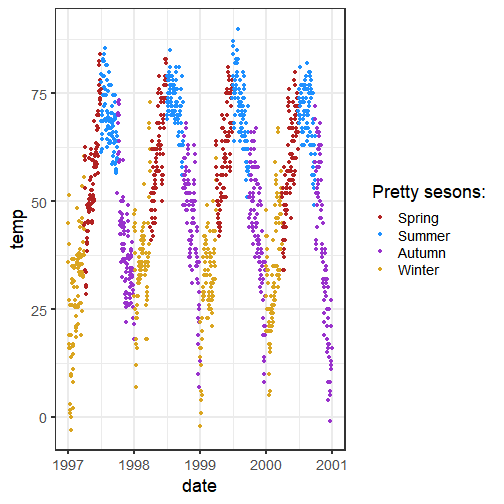<!-- --> ] --- ### **4. Scales: `scale_color_*()` and `scale_fill_*()`** ... or remove the legend for a specific aesthetic: .pull-left[ ```r ggplot(chic, aes(date, temp)) + geom_point(aes(color = season)) + scale_color_manual( values = c( "firebrick", "dodgerblue", "darkorchid", "goldenrod" ), * guide = FALSE ) ``` ] .pull-right[ 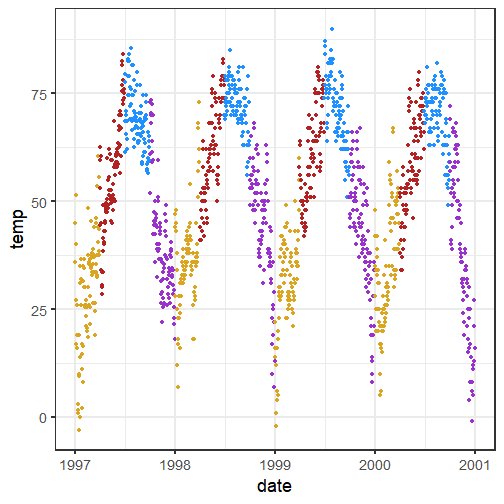<!-- --> ] --- ### **4. Scales: `scale_shape_*()`** ... or remove the legend for a **specific** aesthetic: .pull-left[ ```r ggplot(chic, aes(date, temp)) + geom_point(aes(color = season, * shape = year)) + scale_color_manual( values = c( "firebrick", "dodgerblue", "darkorchid", "goldenrod" ), * guide = FALSE ) + * scale_shape_discrete( * solid = FALSE, * name = "Year" * ) ``` ] .pull-right[ 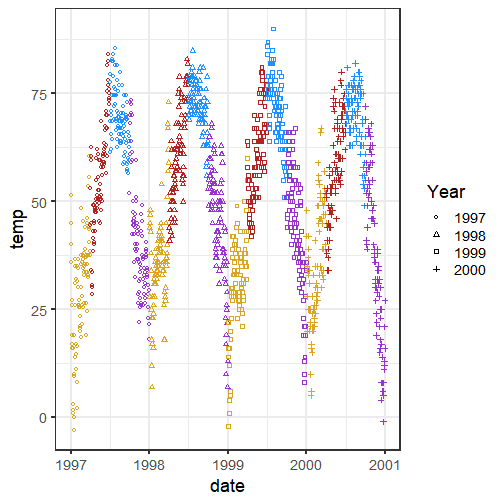<!-- --> ] --- ### **4. Scales: `scale_color_*()` and `scale_fill_*()`** One can of course also use preset color palettes: .pull-left[ ```r ggplot(chic, aes(date, temp)) + geom_point(aes(color = season)) + * scale_color_brewer( * palette = "Set2", guide = FALSE ) ``` ] .pull-right[ <!-- --> ] --- ### **4. Scales: `scale_color_*()` and `scale_fill_*()`** One can of course also use preset color palettes: .pull-left[ ```r ggplot(chic, aes(date, temp)) + geom_point(aes(color = season)) + * scale_color_brewer( * palette = "Set2", guide = FALSE ) ``` Several packages offer predefined palettes, e.g.: * **`{viridis}`** for perceptually uniform palettes * **`{rcartocolor}`** for map color schemes * **`{LaCroixColoR}`** for vibrant summery colors * **`{ggthemes}`** for colors of popular software & publishers Check the [collection by Emil Hvitfeldt](https://github.com/EmilHvitfeldt/r-color-palettes) for a list of color palettes available in **`R`**. ] .pull-right[ 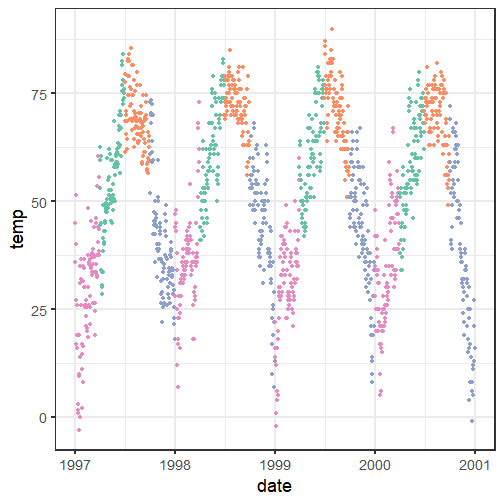<!-- --> ] --- ### **4. Scales: `scale_color_*()` and `scale_fill_*()`** — Color Palettes 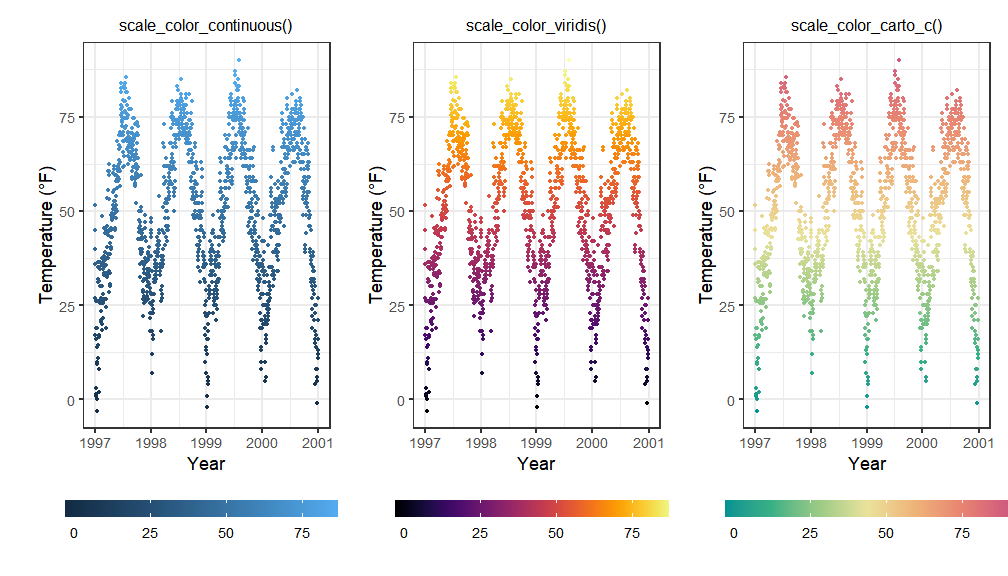<!-- --> --- class: inverse, center, middle # **5. Coordinate System<br><font size=6>`coord_*()`</font>** --- ### **5. Coordinate System: `coord_*()`** Coordinate systems combine the two position aesthetics (usually **`x`** and **`y`**) to produce a 2d position on the plot. <br><br> -- The meaning of the position aesthetics depends on the coordinate system used: * Linear coordinate systems that preserve the shape of geoms:<br><br> + **`coord_cartesian()`**: the default with two fixed perpendicular oriented axes + **`coord_flip()`**: a Cartesian coordinate system with flipped axes + **`coord_fixed()`**: a Cartesian coordinate system with a fixed aspect ratio -- * Non-linear coordinate systems that likely change the shapes:<br><br> + **`coord_map()`**: map projections + **`coord_polar()`**: a polar coordinate system + **`coord_trans()`**: arbitrary transformations to x and y positions --- ### **5. Coordinate System: `coord_cartesian()`** **`coord_*()`** functions allow you to zoom in a plot: .pull-left[ ```r ggplot(chic, aes(date, temp)) + geom_line() + * coord_cartesian( * ylim = c(50, 70) * ) ``` Note that this does prevent a removal of the data points outside the plot area!<br> ] .pull-right[ 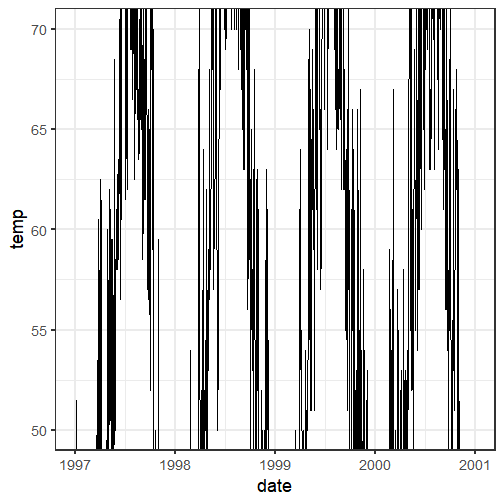<!-- --> ] --- ### **5. Coordinate System: `coord_cartesian()`** In case you want to remove those data points, use **`scale_y_continuous(limits = c(min, max))`**: .pull-left[ ```r ggplot(chic, aes(date, temp)) + geom_line() + * coord_cartesian( * ylim = c(50, 70) * ) ``` 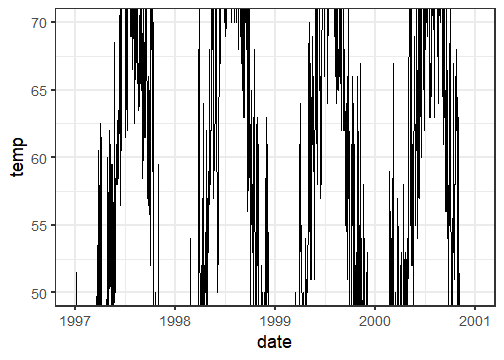<!-- --> ] .pull-right[ ```r ggplot(chic, aes(date, temp)) + geom_line() + * scale_y_continuous( * limits = c(50, 70) * ) ``` 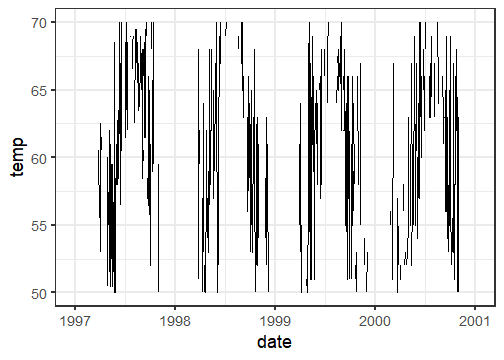<!-- --> ] --- ### **5. Coordinate System: `coord_cartesian()`** In case you want to remove those data points, use **`scale_y_continuous(limits = c(min, max))`**: .pull-left[ ```r ggplot(chic, aes(year, temp)) + geom_boxplot() + * coord_cartesian( * ylim = c(50, 70) * ) ``` 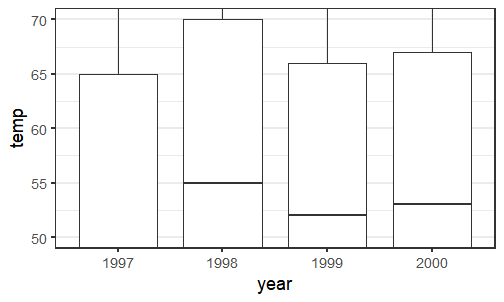<!-- --> ] .pull-right[ ```r ggplot(chic, aes(year, temp)) + geom_boxplot() + * scale_y_continuous( * limits = c(50, 70) * ) ``` <!-- --> ] --- ### **5. Coordinate System: `coord_cartesian()`** `coord_*()` is also used to *prevent clipping* of points and correct alignment of axis ticks: .pull-left[ ```r ggplot(chic, aes(date, temp)) + geom_point() + * scale_x_date( * expand = c(0, 0) * ) + * coord_cartesian(ylim = c(0, 75)) ggplot(chic, aes(date, temp)) + geom_point() + scale_x_date( expand = c(0, 0) ) + coord_cartesian( ylim = c(0, 75), * clip = "off" ) ``` ] .pull-right[ <!-- --><!-- --> ] --- ### **5. Coordinate System: `coord_flip()`** **`coord_flip()`** allows you to flip a Cartesian coordinate system: .pull-left[ ```r ggplot(chic, aes(season, temp)) + geom_col() + * coord_flip() ``` ] .pull-right[ <!-- --> ] --- ### **5. Coordinate System: `coord_polar()`** You can easily transform a rectangular coordinate system into a polar one: .pull-left[ ```r ggplot(chic, aes(season, temp)) + stat_summary(fun.y = mean, geom = "bar") ``` <!-- --> ] .pull-right[ ```r ggplot(chic, aes(season, temp)) + stat_summary(fun.y = mean, geom = "bar") + * coord_polar() ``` 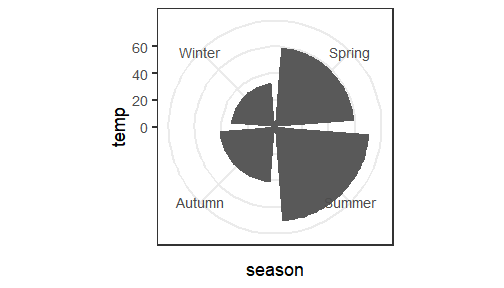<!-- --> ] --- ### **5. Coordinate System: `coord_polar()`** This way, we can create pie charts: .pull-left[ ```r ggplot(chic, aes(factor(1), temp, fill = season)) + geom_col() + * coord_polar() + scale_x_discrete(NULL, expand = c(0, 0)) + scale_y_continuous(NULL, expand = c(0, 0)) ``` 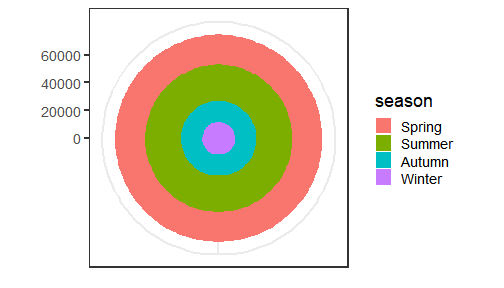<!-- --> ] .pull-right[ ```r ggplot(chic, aes(factor(1), temp, fill = season)) + geom_col() + * coord_polar(theta = "y") + scale_x_discrete(NULL, expand = c(0, 0)) + scale_y_continuous(NULL, expand = c(0, 0)) ``` 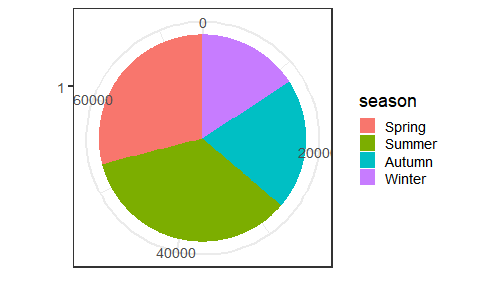<!-- --> ] --- ### **5. Coordinate System: `coord_trans()`** **`coord_*()`** functions allow you to zoom in a plot: .pull-left[ ```r ggplot(chic, aes(o3, temp)) + geom_point() + * coord_trans(x = "log2") ``` ] .pull-right[ 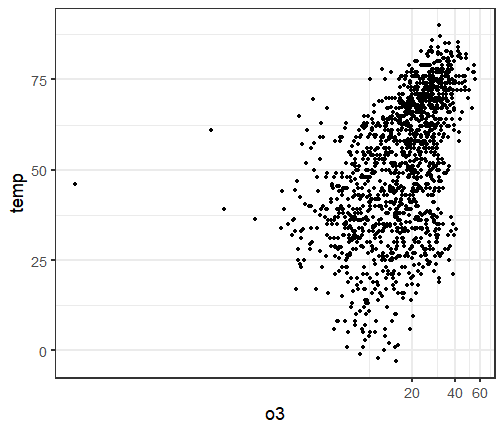<!-- --> ] --- ### **5. Coordinate System: `coord_map()`** Maps often come as polygons and can be plotted via **`geom_polygon()`**: .pull-left[ ```r (g_world <- ggplot(map_data("world"), aes(long, lat, group = group)) + * geom_polygon( * fill = "tan", * color = "grey20" * ) ) ``` ] .pull-right[ <!-- --> ] --- ### **5. Coordinate System: `coord_map()`** Since maps are displaying spherical data, we must project the data via **`coord_map()`**: .pull-left[ ```r g_world + * coord_map(xlim = c(-180,180)) ``` <!-- --> ] .pull-right[ ```r g_world + * coord_map("ortho") ``` <!-- --> ] --- class: inverse, center, middle # **6. Facets<br><font size=6>`facet_*()`</font>** --- ### **6. Facets: `facet_*()`** Facetting generates small multiples each showing a different subset of the data: <p style="text-align:center;"><img src="img/position-facets.png" style="width: 75%"></p> <p style="text-align:right;"><font color="grey" size=2><i>Adapted from "ggplot2: Elegant graphics for data analysis" by Hadley Wickham</i></font></p> --- ### **6. Facets: `facet_wrap()`** **`facet_wrap()`** splits the data into small multiples based on *one grouping variable*: .pull-left[ ```r ggplot(chic, aes(temp, o3)) + geom_point(aes(color = year)) + * facet_wrap(~ season) ``` ] .pull-right[ <!-- --> ] --- ### **6. Facets: `facet_wrap()`** **`facet_wrap()`** splits the data into small multiples based on *one grouping variable*: .pull-left[ ```r ggplot(chic, aes(temp, o3)) + geom_point(aes(color = year)) + facet_wrap(~ season, * scales = "free") ``` It is possible to change the axes range to scale free for each subset (for only one axis to scale free use **`"free_x"`** or **`"free_y"`**. ] .pull-right[ <!-- --> ] --- ### **6. Facets: `facet_grid()`** **`facet_grid()`** spans a grid of each combination of *two grouping variables*: .pull-left[ ```r ggplot(chic, aes(temp, o3)) + geom_point(aes(color = year)) + * facet_grid(season ~ year) ``` ] .pull-right[ <!-- --> ] --- class: inverse, center, middle # **7. Visual Themes<br><font size=6 color = "grey">`theme()` and `theme_*()`</font>** --- ### **7. Visual Themes: `theme()` and `theme_*()`** * Themes control the display of all non-data elements of the plot<br> + titles + labels + fonts + background + gridlines + legends + base size! -- * Themes can be modified for each plot by calling **`theme()`** and **`element_`** functions -- * Themes can be used to give plots a consistent customized look by defining a custom theme using **`theme_update()`** or **`theme_set()`**<br> --- ### **7. Visual Themes: `theme()`** To modify the theme of a plot use **`theme()`** in combination with **`element_*()`**: .pull-left[ ```r ggplot(chic, aes(date, temp)) + geom_point() + * theme( * axis.text = element_text( * size = 15, * face = "bold", * color = "red" * ), * panel.grid.major.x = element_line( * linetype = "dotted", * color = "black" * ), * plot.background = element_rect( * fill = "dodgerblue", * color = "goldenrod" * ) * ) ``` ] .pull-right[ 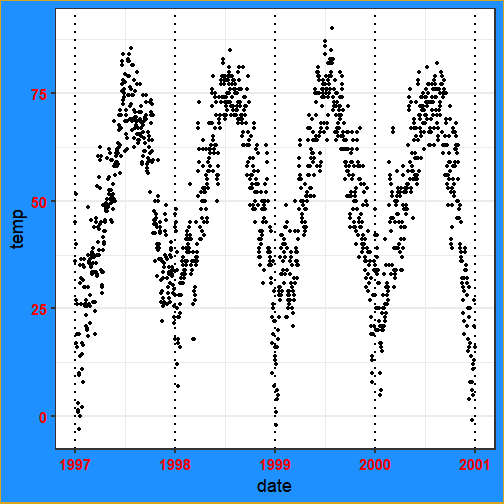<!-- --> ] --- ### **7. Visual Themes: `theme()`** **`element_blank()`** can be used to remove certain theme elements: .pull-left[ ```r ggplot(chic, aes(date, temp)) + geom_point() + * theme( * axis.title.x = element_blank(), * panel.grid.major.y = element_blank(), * panel.grid.minor = element_blank() * ) ``` ] .pull-right[ 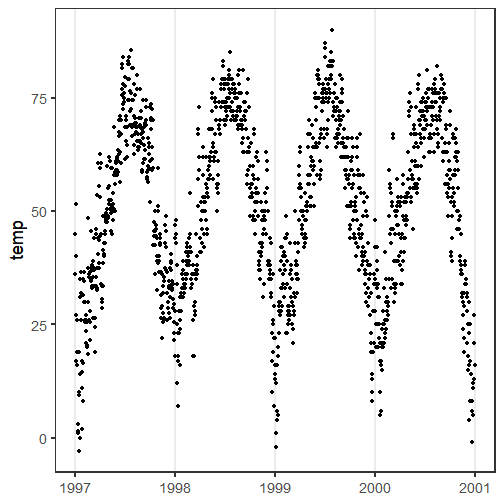<!-- --> ] --- ### **7. Visual Themes: `theme()`** Using the argument **`base_size()`** you can change the size of the text: .pull-left[ ```r ggplot(chic, aes(date, temp)) + geom_point() + * theme_bw(base_size = 40) ``` ] .pull-right[ 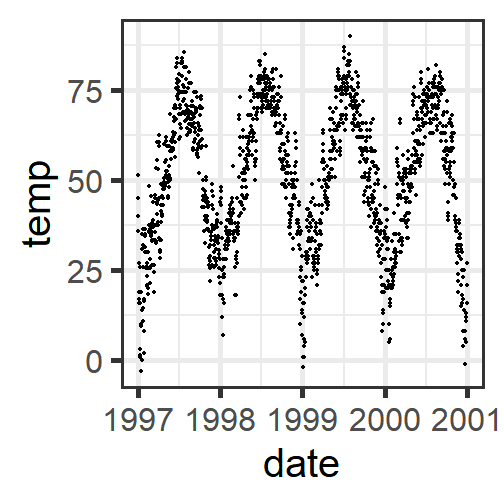<!-- --> ] --- ### **7. Visual Themes: `theme_*()`** Use a built-in theme of **`{ggplot2}`**: .pull-left[ ```r ggplot(chic, aes(date, temp)) + geom_point(aes(color = season)) + * theme_gray() ``` 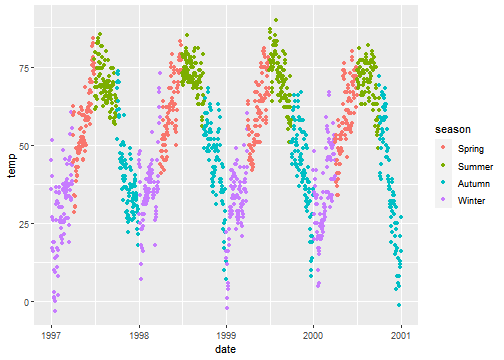<!-- --> ] .pull-right[ <br> ```r ggplot(chic, aes(date, temp)) + geom_point(aes(color = season)) + * theme_classic() ``` <!-- --> ] --- ### **7. Visual Themes: `theme_*()`** ... or extension packages such as **`{ggthemes}`**: .pull-left[ ```r ggplot(chic, aes(date, temp)) + geom_point(aes(color = season)) + * ggthemes::theme_gdocs() + * ggthemes::scale_color_gdocs() ``` <!-- --> ] .pull-right[ ```r ggplot(chic, aes(date, temp)) + geom_point(color = "black") + * ggthemes::theme_tufte() ``` <!-- --> ] --- ### **7. Visual Themes: `theme_*()`** ... or extension packages such as **`{hrbrthemes}`** and **`{tvthemes}`**: .pull-left[ ```r ggplot(chic, aes(date, temp)) + geom_point(aes(color = season)) + * hrbrthemes::theme_ft_rc(grid = "Y") + * hrbrthemes::scale_color_ft() ``` <!-- --> ] .pull-right[ ```r ggplot(chic, aes(date, temp)) + geom_point(aes(color = season)) + * tvthemes::theme_simpsons() + * tvthemes::scale_color_simpsons() ``` <!-- --> ] --- ### **7. Visual Themes: `theme_set()` and `theme_update()`** **`theme_set()`** and **`theme_update()`** override settings completely or partly: .pull-left[ ```r (g <- ggplot(chic, aes(date, temp)) + geom_point()) ``` ] .pull-right[ <!-- --> ] --- ### **7. Visual Themes: `theme_set()` and `theme_update()`** **`theme_set()`** and **`theme_update()`** override settings completely or partly: .pull-left[ ```r (g <- ggplot(chic, aes(date, temp)) + geom_point()) *old <- theme_set(theme_grey()) *g ``` ] .pull-right[ <!-- --> ] --- ### **7. Visual Themes: `theme_set()` and `theme_update()`** **`theme_set()`** and **`theme_update()`** override settings completely or partly: .pull-left[ ```r (g <- ggplot(chic, aes(date, temp)) + geom_point()) old <- theme_set(theme_grey()) g *theme_update( * panel.background = element_rect( * fill = "tan", * color = "black" * ) *) *g ``` ] .pull-right[ <!-- --> ] --- ### **7. Visual Themes: `theme_set()` and `theme_update()`** **`theme_set()`** and **`theme_update()`** override settings completely or partly: .pull-left[ ```r (g <- ggplot(chic, aes(date, temp)) + geom_point()) old <- theme_set(theme_grey()) g theme_update( panel.background = element_rect( fill = "tan", color = "black" ) ) g *theme_set(old) *g ``` ] .pull-right[ <!-- --> ] --- class: center, middle # **Some more?** --- class: inverse, center, middle # **Working with Text** --- ### **Working with Text: Title, Subtitle, Caption, and Tag** To quickly add a title, use **`ggtitle()`**: .pull-left[ ```r ggplot(chic, aes(date, temp)) + geom_point() + * ggtitle("Temperatures in Chicago") ``` ] .pull-right[ <!-- --> ] --- ### **Working with Text: Title, Subtitle, Caption, and Tag** **`{ggplot2}`** has a built-in structure for title, subtitle, caption and tags via **`labs()`**: .pull-left[ ```r (g <- ggplot(chic, aes(date, temp)) + geom_point() + * labs( * x = "Year", * y = "Temperature (°F)", * title = "Temperatures in Chicago", * subtitle = "Seasonal pattern of daily temperatures\nfrom 1997 to 2001", * caption = "Data: NMMAPS", * tag = "(a)" * ) ) ``` ] .pull-right[ <!-- --> ] --- ### **Working with Text: Title, Subtitle, Caption, and Tag** **`{ggplot2}`** has a built-in structure for title, subtitle, caption and tags: .pull-left[ ```r g + * theme( * plot.title = element_text( * size = 20, * face = "bold", * hjust = 1, * margin = margin(15, 0, 15, 0) * ), * plot.caption = element_text( * face = "italic" * ), * plot.tag.position = c(0.15, 0.75) * ) ``` ] .pull-right[ <!-- --> ] --- ### **Working with Text: `annotate("text")`** **`annotate()`** allows to add text inside the plot area: .pull-left[ ```r ggplot(chic, aes(date, temp)) + geom_point() + * annotate( * "text", * x = as.Date("1998-07-01"), * y = 10, * label = "The Summer\nof 1998", * size = 3, * fontface = "bold", * color = "firebrick" * ) ``` ] .pull-right[ <!-- --> ] --- ### **Working with Text: `annotate("text")`** The **`annotate()`** function comes from ggplot2 and is designed to use a so-called **grob** as input: .pull-left[ ```r ggplot(chic, aes(date, temp)) + geom_point() + annotate( "text", x = as.Date("1998-07-01"), y = 10, label = "The Summer\nof 1998", size = 3, fontface = "bold", color = "firebrick" ) + * facet_wrap(~ year, scales = "free_x") ``` ] .pull-right[ <!-- --> ] --- ### **Working with Text: `annotation_custom(grob)`** **`annotation_custom()`** allows to add text by relative positions which solves the problem: .pull-left[ ```r *text <- grid::grobTree( * grid::textGrob( * "Summertime!", * x = 0.5, y = 0.1, hjust = 0.5, * gp = grid::gpar( * fontsize = 12, * fontface = "bold", * col = "firebrick" * ) * ) *) ggplot(chic, aes(date, temp)) + geom_point() + * annotation_custom(text) + facet_wrap(~ year, scales = "free_x") ``` ] .pull-right[ <!-- --> ] --- ### **Working with Text: `element_markdown()` via `{ggtext}`** With the new **`{ggtext}`** package, it is possible to use Markdown and basic HTML within strings: .pull-left[ ```r *library(ggtext) ggplot(chic, aes(date, temp)) + geom_point(aes(color = season)) + scale_color_manual( name = NULL, values = c("#0072B2", "#009E73", "#FF8423", "#B22222"), * labels = c( * "<b style='color:#0072B2'>Spring:<br></b><i>Apr to Jun<br></i>", * "<b style='color:#009E73'>Summer:</b><br><i>Jul to Sep<br></i>", * "<b style='color:#FF8423'>Autumn:</b><br><i>Oct to Dec<br></i>", * "<b style='color:#B22222'>Winter:</b><br><i>Jan to Mar<br></i>" * ) ) + * theme(legend.text = element_markdown()) ``` ] .pull-right[ <!-- --> ] --- class: inverse, center, middle # **Working with Images** --- ### **Working with Images: `annotation_custom(grob)`** The **`annotation_custom()`** function comes with ggplot2 and is designed to use a so-called **grob** as input: .pull-left[ ```r *img <- png::readPNG("./img/logo.png") *logo <- grid::rasterGrob(img, interpolate = T) ggplot(chic, aes(date, temp)) + * annotation_custom( * logo, * xmin = as.Date("1997-06-01"), * xmax = as.Date("2000-06-01"), * ymin = 0, * ymax = 80 * ) + geom_point() ``` ] .pull-right[ <!-- --> ] --- class: inverse, center, middle # **Working with Geometric Forms** --- ### **Working with Geometric Forms: `annotate("rect")`** Let's add some background indicating the years: .pull-left[ ```r ggplot(chic, aes(date, temp)) + * annotate( * "rect", * xmin = as.Date("1997-01-01"), * xmax = as.Date("1997-12-31"), * ymin = -Inf, ymax = Inf, * color = NA, alpha = 0.2 * ) + * annotate( * "rect", * xmin = as.Date("1999-01-01"), * xmax = as.Date("1999-12-31"), * ymin = -Inf, ymax = Inf, * color = NA, alpha = 0.2 * ) + geom_point() ``` ] .pull-right[ <!-- --> ] --- ### **Working with Geometric Forms: `annotate("rect")` or `geom_rect()`?** If you plot many elements, use **`geom_rect()`**: .pull-left[ ```r *rect <- tibble( * xmin = as.Date(c("1997-01-01", "1999-01-01")), * xmax = as.Date(c("1997-12-31", "1999-12-31")), * ymin = rep(-Inf, 2), * ymax = rep(Inf, 2) *) ggplot(chic) + * geom_rect( * data = rect, * aes(xmin = xmin, xmax = xmax, * ymin = ymin, ymax = ymax), * color = NA, * alpha = 0.2 * ) + geom_point(aes(date, temp)) ``` ] .pull-right[ 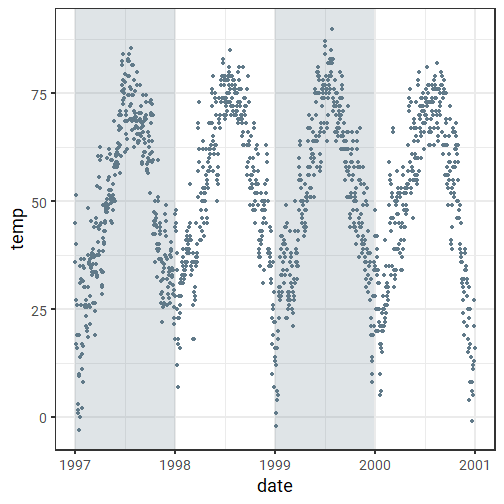<!-- --> ] --- ### **Working with Geometric Forms: `geom_abline()`, `geom_vline()` and `geom_hline()`** We could also indicate new years by a vertical line: .pull-left[ ```r *lines <- tibble( * xintercept = seq( * as.Date("1997-01-01"), * as.Date("2001-01-01"), * length.out = 5) *) ggplot(chic, aes(date, temp)) + geom_point() + * geom_vline( * data = lines, * aes(xintercept = xintercept)) ``` There are also **`geom_abline()`** and **`geom_hline()`**. ] .pull-right[ 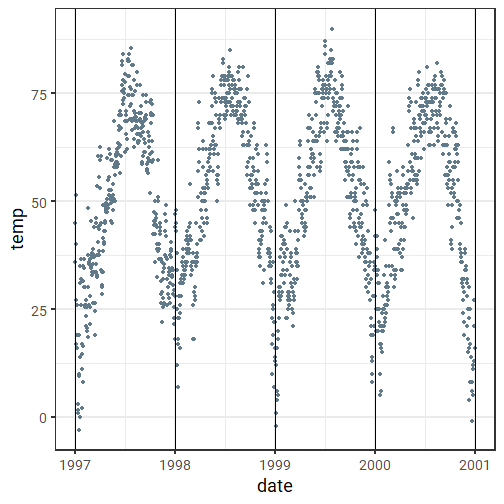<!-- --> ] --- class: inverse, center, middle # **You want even more?** --- <font size=2> * **Free Online Books:** + "ggplot2: Elegant Graphics for Data Analysis" by Hadley Wickham → [ggplot2-book.org](https://ggplot2-book.org/) + "R for Data Science" by Hadley Wickham → [r4ds.had.co.nz](https://r4ds.had.co.nz/) + "Data Visualization: A Practical Introduction" by Kieran Healy → [socviz.co](https://socviz.co/) + "Fundamentals of Data Visualization" by Claus Wilke → [serialmentor.com/dataviz](https://serialmentor.com/dataviz/) + R Graph Gallery → [r-graph-gallery.com](https://www.r-graph-gallery.com/) + ggplot2 Extension Gallery → [ggplot2-exts.org/gallery](http://www.ggplot2-exts.org/gallery/) + Color Palettes in R → [github.com/EmilHvitfeldt/r-color-palettes](https://github.com/EmilHvitfeldt/r-color-palettes/) + #TidyTuesday Collection → [tidytuesday.rocks](http://tidytuesday.rocks/) * **Get Help:** + RStudio Community → [community.rstudio.com](wwww.community.rstudio.com) + R4DS Learning Community → [rfordatasci.com](https://www.rfordatasci.com) + #TidyTuesday Community → [#TidyTuesday on Twitter](https://twitter.com/hashtag/tidytuesday?lang=en) * **Useful Packages:** + **`{ggtext}`** — rich-text rendering → [github.com/clauswilke/ggtext](https://github.com/clauswilke/ggtext) + **`{ggforce}`** — several interesting add-on features → [ggforce.data-imaginist.com](https://ggforce.data-imaginist.com/) + **`{ggridges}`** — geoms for joy plots → [github.com/clauswilke/ggridges](https://github.com/clauswilke/ggridges) + **`{ggrepel}`** — prevent overlapping text labels → [github.com/slowkow/ggrepel](https://github.com/slowkow/ggrepel) + **`{gganimate}`** — create animations → [gganimate.com](https://gganimate.com/) + **`{ggplotly}`** — create interactive plots → [plot.ly/ggplot2](https://plot.ly/ggplot2/) + **`{ggraph}`** — networks, graphs & trees → [github.com/thomasp85/ggraph](https://github.com/thomasp85/ggraph) + **`{ggalt}`** — alternative coords, geoms, stats & scales → [github.com/hrbrmstr/ggalt](https://github.com/hrbrmstr/ggalt) + **`{ggpubr}`** — publication-ready plot in one line → [github.com/kassambara/ggpubr](https://github.com/kassambara/ggpubr) + **`{ggmaps}`** — access to Google & Stamen maps → [github.com/dkahle/ggmap](https://github.com/dkahle/ggmap) + **`{ggthemes}`** — additional themes, sclaes & geoms → [github.com/jrnold/ggthemes](https://github.com/jrnold/ggthemes) + **`{hrbrthemes}`** — typography-centric themes → [github.com/hrbrmstr/hrbrthemes](https://github.com/hrbrmstr/hrbrthemes) + **`{lemon}`** — axis & legend add-ons → [github.com/stefanedwards/lemon](https://github.com/stefanedwards/lemon) + **`{cowplot}`** — plot arrangements, themes & annotations → [wilkelab.org/cowplot](https://wilkelab.org/cowplot/articles/introduction.html) + **`{patchwork}`** — combine ggplots → [github.com/thomasp85/patchwork](https://github.com/thomasp85/patchwork) + **`{showtext}`** — use custom fonts → [github.com/yixuan/showtext](https://github.com/yixuan/showtext) + **`{showtext}`** — hillshaded maps in 2D & 3D → [github.com/tylermorganwall/rayshader](https://github.com/tylermorganwall/rayshader) .logo[ <img src="./img/logo_ressources.png" width="1328" /> ]--- <font size=2> * **Free Online Books:** + "ggplot2: Elegant Graphics for Data Analysis" by Hadley Wickham → [ggplot2-book.org](https://ggplot2-book.org/) + "R for Data Science" by Hadley Wickham → [r4ds.had.co.nz](https://r4ds.had.co.nz/) + "Data Visualization: A Practical Introduction" by Kieran Healy → [socviz.co](https://socviz.co/) + "Fundamentals of Data Visualization" by Claus Wilke → [serialmentor.com/dataviz](https://serialmentor.com/dataviz/) + **Galleries:** + R Graph Gallery → [r-graph-gallery.com](https://www.r-graph-gallery.com/) + ggplot2 Extension Gallery → [ggplot2-exts.org/gallery](http://www.ggplot2-exts.org/gallery/) + Color Palettes in R → [github.com/EmilHvitfeldt/r-color-palettes](https://github.com/EmilHvitfeldt/r-color-palettes/) + #TidyTuesday Collection → [tidytuesday.rocks](http://tidytuesday.rocks/) * **Get Help:** + RStudio Community → [community.rstudio.com](wwww.community.rstudio.com) + R4DS Learning Community → [rfordatasci.com](https://www.rfordatasci.com) + #TidyTuesday Community → [#TidyTuesday on Twitter](https://twitter.com/hashtag/tidytuesday?lang=en) * **Useful packages:** + **`{ggtext}`** — rich-text rendering → [github.com/clauswilke/ggtext](https://github.com/clauswilke/ggtext) + **`{ggforce}`** — several interesting add-on features → [ggforce.data-imaginist.com](https://ggforce.data-imaginist.com/) + **`{ggridges}`** — geoms for joy plots → [github.com/clauswilke/ggridges](https://github.com/clauswilke/ggridges) + **`{ggrepel}`** — prevent overlapping text labels → [github.com/slowkow/ggrepel](https://github.com/slowkow/ggrepel) + **`{gganimate}`** — create animations → [gganimate.com](https://gganimate.com/) + **`{ggplotly}`** — create interactive plots → [plot.ly/ggplot2](https://plot.ly/ggplot2/) + **`{ggraph}`** — networks, graphs & trees → [github.com/thomasp85/ggraph](https://github.com/thomasp85/ggraph) + **`{ggalt}`** — alternative coords, geoms, stats & scales → [github.com/hrbrmstr/ggalt](https://github.com/hrbrmstr/ggalt) + **`{ggpubr}`** — publication-ready plot in one line → [github.com/kassambara/ggpubr](https://github.com/kassambara/ggpubr) + **`{ggmaps}`** — access to Google & Stamen maps → [github.com/dkahle/ggmap](https://github.com/dkahle/ggmap) + **`{ggthemes}`** — additional themes, sclaes & geoms → [github.com/jrnold/ggthemes](https://github.com/jrnold/ggthemes) + **`{hrbrthemes}`** — typography-centric themes → [github.com/hrbrmstr/hrbrthemes](https://github.com/hrbrmstr/hrbrthemes) + **`{tvthemes}`** — TV-inspired themes → [github.com/Ryo-N7/tvthemes](https://github.com/Ryo-N7/tvthemes) + **`{lemon}`** — axis & legend add-ons → [github.com/stefanedwards/lemon](https://github.com/stefanedwards/lemon) + **`{cowplot}`** — plot arrangements, themes & annotations → [wilkelab.org/cowplot](https://wilkelab.org/cowplot/articles/introduction.html) + **`{patchwork}`** — combine ggplots → [github.com/thomasp85/patchwork](https://github.com/thomasp85/patchwork) + **`{showtext}`** — use custom fonts → [github.com/yixuan/showtext](https://github.com/yixuan/showtext) + **`{rayshader}`** — hillshaded maps in 2D & 3D → [github.com/tylermorganwall/rayshader](https://github.com/tylermorganwall/rayshader) .logo[ <img src="./img/logo_ressources.png" width="1328" /> ]